Friday, 20 January 2017

Applying BCG Matrix into our Dividend Portfolio

I learnt a management concept called Boston Consulting Group (BCG) Matrix when I was in College. BCG Matrix was created in 1970s to help corporation analyse its business unit.

While this sharing is not meant to dwell into details of BCG Matrix. The Matrix is simple to understand, but does have its limitations as the Matrix is only based on 2 dimensional perspective i.e growth rate and market share. 
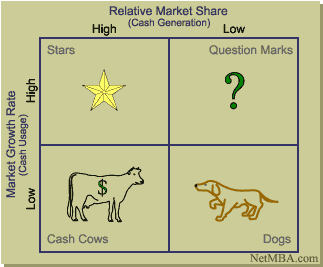
Image result for bcg matrix

Simplistically, a company which is categorized as cash cow is a company which has high market share in a slow-growing industry or matured industry, Cash cow generates plenty of cash flow in excess of the cash that is needed to maintain the business. Hence, cash cow business division is highly valuable to a corporation.

Similarly, cash cow is valuable to a dividend investor due to the ability of the company to earn a sustainable earnings and operating cashflow. Higher operating cashflow and lesser capital expenditure translates into healthy free cash flow which could be used to pare down debts or reward the shareholders via cash dividends.

Cash cow with stable or low business growth can also complement an equity investor's portfolio. We  can mix cash cow and other companies which are in growing industry.

'Star' companies can also be a good choice for investment. 'Star' companies may eventually become  cash cow when the industry growth slows.

The company to avoid is basically the 'Dogs', of which BCG Matrix defines as business that has low growth rate and low market share, and this business might barely produce enough cash flow to sustain its market share. 

Company that falls under 'Question Marks' consumes more cash that the amount it generates, has low market share in fast growing industry, it may evolve into a 'Star' performer but how long will it takes to be a performer, remains uncertain. Investor with higher risk appetite might invest into this type of companies.

It is simplistic to categorize companies based on the 4 quadrants as the 2 dimensions mentioned above are not sufficient to identify a good company.

I would prefer companies that fall between categories of 'cash cow' and 'star'.

The combined factors are:

1) Improving market share or market leader
2) Reasonable business growth of at least matching our economic growth or more in the long run.

Hopefully, these companies will be able to add value to our equity portfolio in our quest to build sustainable wealth via its rising earnings and rising dividend payout.

Happy hunting for your 'cash star' (cash cow +  star)

Sunday, 15 January 2017

Financial Ratio that a Dividend Investor Should Not Neglect!

Would you invest into companies which are profitable, but without the corresponding operating cash flow?

Cash is king for a company. If a company does not generate sufficient cash flow despite beautiful profit, the company may have challenges in sustaining its operations or even pay salaries to employees. 

Dividend investors will need to be mindful of the above scenario. Before we invest our hard earned money, do assess if the company's profit is eventually backed by operating cash flow.

If a company makes RM100 million profit, how much of this profit translate into operating cash flow at the end of the day?

2011
2012
2013
2014
2015
Operating cash flow (CFO) (RM mil)
195.3
180.2
225.6
236.2
295.1
Net Profit (RM mil)
181.3
207.3
217.6
198.2
214.1
CFO/Net Profit
107%
87%
104%
119%
137%
Source: Heineken Malaysia’s Annual Report

The example above depicts Heineken Malaysia's historical net profit and its operating cash flow (CFO) trend.

What can we dissect from the table above?

By looking at CFO / Net Profit metric, we can conclude that Heineken Malaysia's historical profit is backed by operating cash flow which is a positive sign. 

This CFO / Net Profit would have validated our assessment of a company's quality of earnings because there is no point to be profitable, but cash flow poor.

Hence, before we shoot our bullet, do assess the above metric in order to minimize our downside risk.

CFO/ Net Profit is surely one of the key ratios that a dividend investor should not miss!

Will elaborate more on other ratios in the future post:)


Tuesday, 10 January 2017

I Started Dating with Singapore Retail REITs

The business headlines in Malaysia has been quite negative in recent months, we have weak Ringgit, slow economic growth, corruption news and more.

We are unlikely to progress much if we focus on events that are out of our control. What we could do is to adopt the chess method as highlighted by Geoff Colvin in his book called– Talent is Overrated.

When we read news, do ask ourselves:-

What is my next move after reading this news? What can I do to benefit from events surrounding me? 

What can I do to better myself after reading the news?

Weak ringgit and rising cost of living might dent our morale, but let’s focus on the circle of influence as there are many things that are within our control. If we think SGD may strengthen in the next decades against MYR and we intend to send our kids to Singapore for tertiary education..we could start planning now..

Image result for circle of concern

For example, I have started to learn more on Singapore Retail REITs with the aim to accumulate some SGD assets and keep it invested for the next 15-20 years’ time. The SGD funds could be used as child education fund or retirement fund in the future. There is no hard and fast rule.

Learning on certain asset class will also keep us occupied and hence, less attention on noises or events beyond our control.

Singapore REITs seem to be more attractive compared to Malaysia REITs due to tax exemption for distribution received for individual investors, ample choices of REITs in Singapore and better distribution yield compared to Malaysia REITs.

Nonetheless, I am also cognisant of the risk involved by investing into say, Singapore Retail REITs in view of the slowdown in retail spending and economic trajectory in Singapore amidst challenging global economic environment especially for a country that relies heavily on trades.

I will also explore the rental trend of urban and sub-urban malls in Singapore, how innovative is the REIT manager in navigating the challenging retail landscape and how proactive is the REIT manager in reducing the potential impact to the Trust given the backdrop of potential increase in US interest rates. 

An increase in US interest rates will impact funding cost for Singapore REIT since US interest rates will influence rates in Singapore i.e. Singapore Interbank Offer Rate (SIBOR).

To conclude, there are so many things that we could explore, hence, let’s occupy ourselves on things that are within our control to improve our well being.


Wednesday, 4 January 2017

Important Lesson that We Could Learn from FGV's Plunge in Share Price

There is one step that I would usually do first prior to any equity investment which is to look into the companies' historical price chart. 

What has been the historical trend of the price chart? long term uptrend? long term downtrend? volatile? flat?

There will bound to be some fluctuation in prices in short term, but a company with strong fundamentals should see long term uptrend in its share prices as market will eventually acknowledge the success of these good companies if one believes in fundamental analysis.

     Source: Bursa Malaysia

I do know someone who bought into the Felda Global Ventures (FGV) and suffered huge losses! The price chart above refers to FGV's share price performance. 

Investors will definitely be MAD if the share price of his equity investments perform like the above.

Imagine if we suffer more than 50% losses? 

Say from RM100k declined to RM50k, to gain back to RM100k, the existing smaller investment base of RM50k needs to generate 100% return in order to reach break-even level, is it easy to make 100% in stock market? how confident are we in making such amount of return in short term just to break-even?

Hence, avoiding bad companies is very important to manage downside risk.

FGV has suffered from the following:

1) Plunge in Profit.
2) Fraud at Turkish Unit.
3) Investors' concerns on the aggressive acquisition appetite of previous CEO which burnt tonnes of cash.
4) Political influence and more.

The Turkish Fraud discovered in November 2016 was like another bombshell to investors, reinforced investors' view that fundamentals of FGV remains poor. Therefore, it is not surprising that EPF eventually sold off its shareholding in FGV recently.

In our journey to become a successful equity investor, do not just focus to look for good companies, we must be mindful of bad companies as well in order to manage downside risk and optimise upside returns.

To my readers, happy investing in 2017:)